Load and Explore Weather Data with ELK Cluster
For demonstration purpose, we will feed weather data from OpenWeatherMap into Elasticsearch. Here, we’ll use logstash to ingest data from OpenWeatherMap into elasticsearch. Please see more examples of logstash configurations.
Prerequisites
User must create an account on OpenWeatherMap and have an APPID. We’ll use free service of OpenWeatherMap.
1. Create an index mappings (database schema) on ELK cluster
In the Cerebro Web UI, click on the rest menu.

Enter the index name “weather” and select “PUT”. Copy and paste the following mappings into the textbox as shown in the figure below.
{
 "mappings": {
  "doc": {
   "properties": {
    "id": {"type" : "long"},
    "name": {"type" : "keyword"},
    "rain": {"type" : "float"},
    "temp": {"type" : "float"},
    "humidity": {"type" : "float"},
    "pressure": {"type" : "float"},
    "description": {"type" : "text"},
    "coord": {"type": "geo_point"}
   }
  }
 }
}
The id and name are the station ID and name, respectively. The field coord is the location (lat/long) of the station. We define the mappings for relevant fields. Other fields are automatically detected by Elasticsearch.

Scroll down to the bottom of the page, and click  . Then, check if the mappings is successfully created in the right textbox.

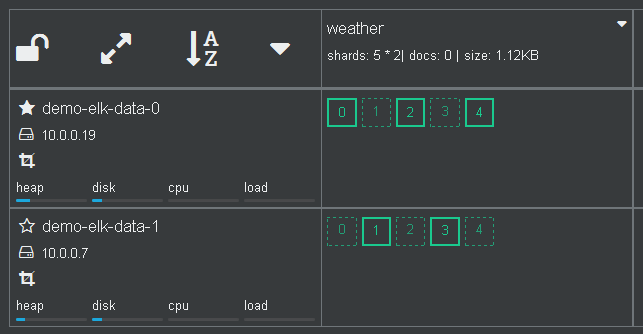
Go back to the Cerebro overview page. Now an empty index (docs: 0) is created.
2. Login to the the client (coordinating-only) node.
Note that login to any node would work, actually.
Find the IP address of the client node. Click on the cluster name to see the general information of the cluster.

The IP adress and port of services on all nodes are shown. Take note of the IP address of the client node shown in coordinating-only.

Use ssh tool to login to the client node. Remember to use the matching keypair.
ssh centos@<CLIENT_IP>
[centos@demo-elk-client-0 ~]$
3. Create logstash config
Create the weather.conf file for logstash. There are three sections: input, filter and output, which define how to get weather data from the OpenWeatherMap service, transform them and load into Elasticsearch.
Replace APPID with yours.
input {
 http_poller {
   urls => {
     myurl => "http://api.openweathermap.org/data/2.5/find?lat=13.75&lon=100.51&appid=APPID&units=metric&cnt=50"
   }
   schedule => { cron => "*/15 * * * * UTC"}
   codec => "json"
 }
}

filter {
  split {
    field => "list"
  }

  ruby { # copy (nested) fields in list to root
    code => "
      event.get('list').each {|k, v|
        event.set(k,v)
      }
      event.remove('list')
    "
  }
  date { # convert timestamp to date
    match => ["dt", "UNIX"]
    timezone => "Asia/Bangkok"
  }
  mutate {
    copy => {
      "[main][temp]" => "temp"
      "[main][pressure]" => "pressure"
      "[main][humidity]" => "humidity"
      "[weather][0][description]" => "description"
    }
    rename => {
      "[coord][Lat]" => "[coord][lat]"
      "[coord][Lon]" => "[coord][lon]"
    }
    remove_field => ["host", "calctime", "count", "main", "weather"]
  }
}

output {
  elasticsearch {
    hosts => ["http://localhost:9200"]
    document_id => "%{id}_%{dt}"
    index => "weather"
  }

  stdout { codec => dots }
}
In this example, the input section defines the http poller to retrieve the current weather from OpenWeatherMap every 15 minutes. Due to the free service, it allows up to 50 stations around the center point, and the data is from last hour. The center in the example is located at Bangkok. Several input plugins are available.
The filter section defines the transformation of OpenWeaterMap data for indexing in ELK cluster. Shortly, it extracts relevant fields from nested structure and put them into the root and creates timestamp. The output section load each station data into Elasticsearch. Each document has an ID set to stationID_timestamp. Note that these data is updated with 30-min interval. So, our 15-min polling is enough.
4. Run logstash
Run the following command. Keep it running.
/opt/logstash/bin/logstash -w 1 -f weather.conf
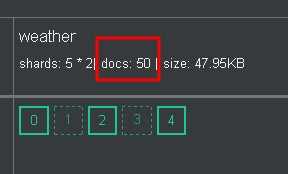
After 15 min, data will continuously be injected into Elasticsearch.
5. Explore and visualize data
On the cluster general information page, click on the Kibana URL. From Kibana page, create an index pattern and start discovering and visualizing data.


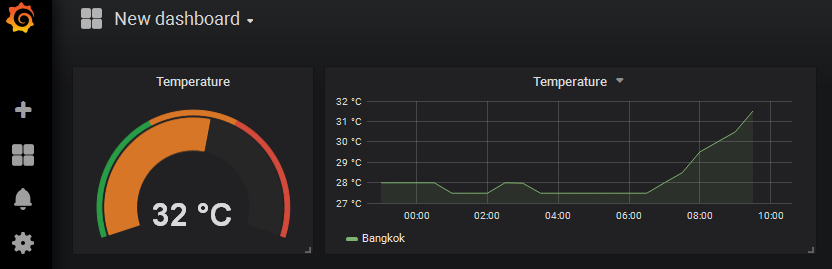
User may create a grafana dashboard as shown below.